
MySuper product dashboard
The CBUS superannuation product dashboard is set out to help you better understand the fees and costs, risks and performance for our default investment option, Growth (MySuper). You can use the dashboard to compare the Growth (MySuper) investment option with MySuper products offered by other funds.
The Growth (CBUS MySuper) investment option was launched on 1 October 2013 and was previously named Growth (Choice). The performance history includes the period before the MySuper launch. Effective 14 February 2022, the Growth (CBUS MySuper) investment option has been renamed to Growth (MySuper).
The information shown in the dashboard is based on a representative member with an assumed balance of $50,000. For more information on how to choose the right MySuper fund for you, go to the ASIC MoneySmart website.
Return
10-year average return of 7.85% per year as at 30 June 2026.
Return target
The return target for 2027-2036 is 3.50% per year above inflation, after fees and taxes. Future returns cannot be guaranteed. See the explanation below.
Level of investment risk (Standard Risk Measure)
Medium to high (Risk Band 5)
Negative returns expected in 3 to 4 out of every 20 years. Negative returns may occur more or less frequently than expected. The higher the expected return target, the more often you would expect a year of negative returns.
For more information, see our risk levels.
Statement of fees and costs
$417 per year
Fees and costs for a member with a $50,000 balance. Different account balances will have an effect on fees and costs.
Comparison between return target and return
For financial years ending 30 June*
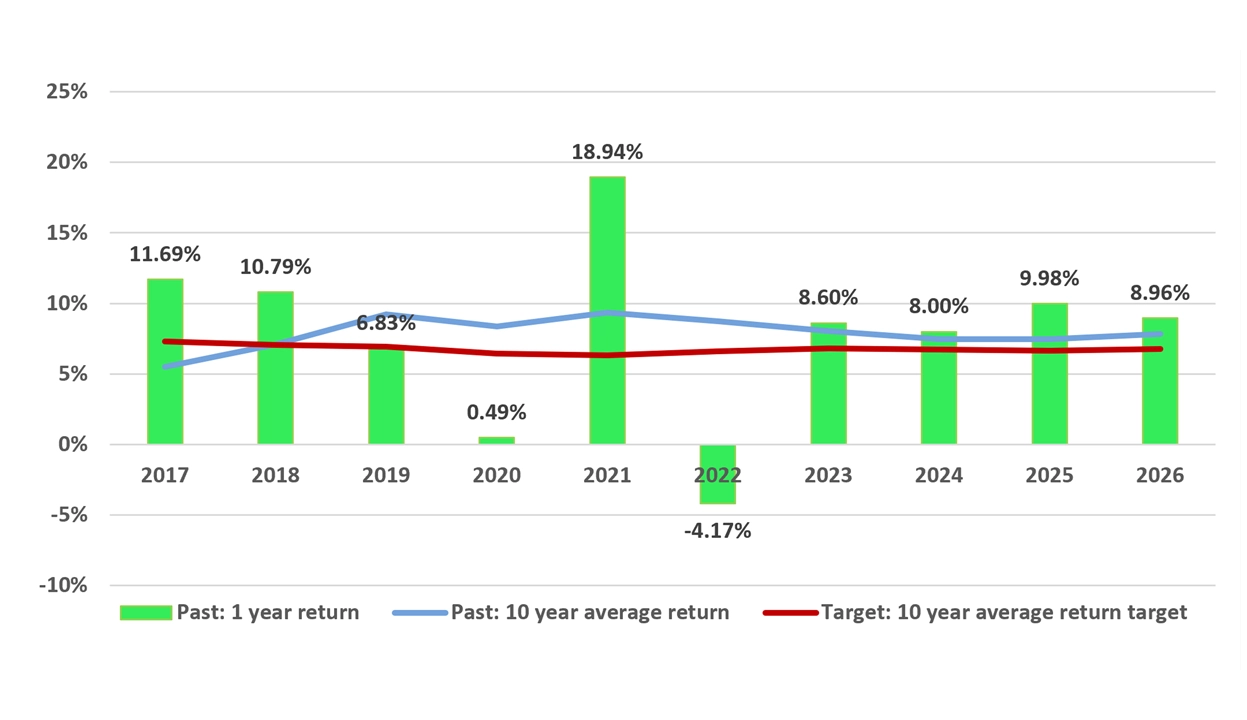
*Past performance is not necessarily an indication of future returns.
Dashboard explanation
The following section provides further explanation of the terms used above.