

A history of strong returns
When you join CBUS, your super will be invested in the default Growth (MySuper) option, or you can choose how your super is invested. See how each of our investment options have performed over the long term.
8.92% average annual return^ over the last 42 years
As at 30 June 2026 for the Growth (MySuper) option.
Super investment performance
To 30 September 20261
| 1 month % | Financial Year to Date % | 1 year (%) | 3 years p.a. (%) | 5 years p.a. (%) | 10 years p.a (%) | |
|---|---|---|---|---|---|---|
| Growth (MySuper) | -0.20% | 1.27% | 7.17% | 9.94% | 6.46% | 7.89% |
| High Growth | -0.33% | 1.38% | 7.16% | 11.73% | 7.62% | 9.51% |
| Growth Plus | -0.31% | 1.28% | 7.21% | 10.82% | n/a | n/a |
| Indexed Diversified | -0.57% | 0.68% | 5.59% | 11.34% | n/a | n/a |
| Conservative Growth^ | -0.21% | 0.92% | 5.45% | 7.92% | 4.87% | n/a |
| Conservative | -0.21% | 0.55% | 3.95% | 5.83% | 3.41% | 4.27% |
| Overseas Shares | 1.30% | 1.71% | 7.84% | 15.72% | n/a | n/a |
| Australian Shares | -2.28% | 1.69% | 3.02% | 10.32% | n/a | n/a |
| Property | -2.10% | -2.30% | 6.97% | 5.52% | n/a | n/a |
| Diversified Fixed Interest | -0.67% | -0.47% | 1.75% | 4.53% | n/a | n/a |
| Cash | 0.33% | 1.03% | 3.82% | 3.99% | 3.18% | 2.11% |
1This table shows the most recent crediting rates (published monthly on or around 14 to 21 days following each months reporting period).
Please note, the Growth Plus, Indexed Diversified, Overseas Shares, Australian Shares, Property and Diversified Fixed Interest options commenced on 14 February 2022 therefore crediting rate information for longer time periods are not applicable.
Investment performance is based on the crediting rate, which is the investment return minus investment fees and costs, transaction costs and investment-related taxes and until 31 January 2020, the percentage-based administration fee. Excludes fees and costs that are deducted directly from members’ accounts. Past performance is not a reliable indicator of future performance.
^The Conservative Growth accumulation option commenced on 6 July 2017 therefore crediting rate information for longer time periods are not applicable.
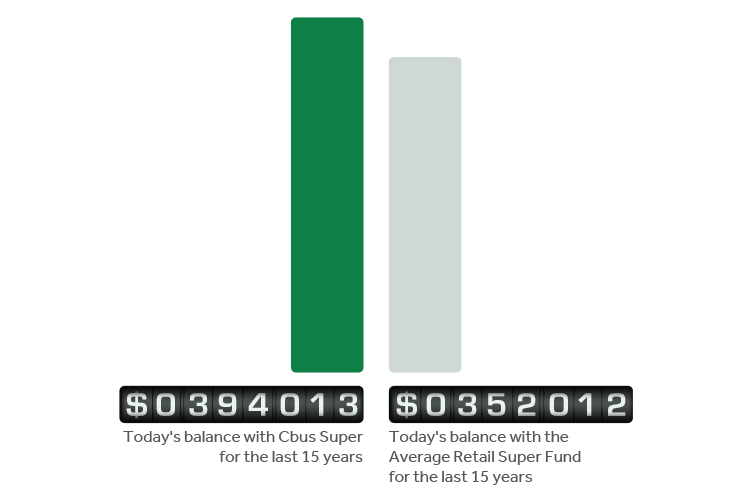
Compare CBUS using SuperRatings*
See how we compare
Use the calculator to see how much better off you could be with CBUS compared to the average retail super fund.
*As at 30 June 2025. Based on an income of $80,000 and a starting super balance of $50,000 modelled by SuperRatings. Full assumptions available on SuperCalculator.
Why choose us?
Competitive fees
Keeping our fees competitive to benefit our members.
Investing in members
Strengthening Australia’s economy by supporting industries that are important to our members.
Insurance Cover
Choose the level of insurance cover that is right for you.**
** Insurance is issued under a group policy with our insurer TAL Life Limited ABN 70 050 109 450 AFSL 237848.
Read our Product Disclosure Statements (PDS).

^ Since inception on 1 July 1984 to 30 June 2026. The crediting rate for the Growth (MySuper) investment option is based on investment returns minus investment fees and costs, transaction costs and investment-related taxes and until 31 January 2020, the percentage-based administration fee. Excludes fees and costs that are deducted directly from members’ accounts. Past performance is not a reliable indicator of future performance.