
Calendar year return key messages
- 2025 was a strong year for our members investment returns
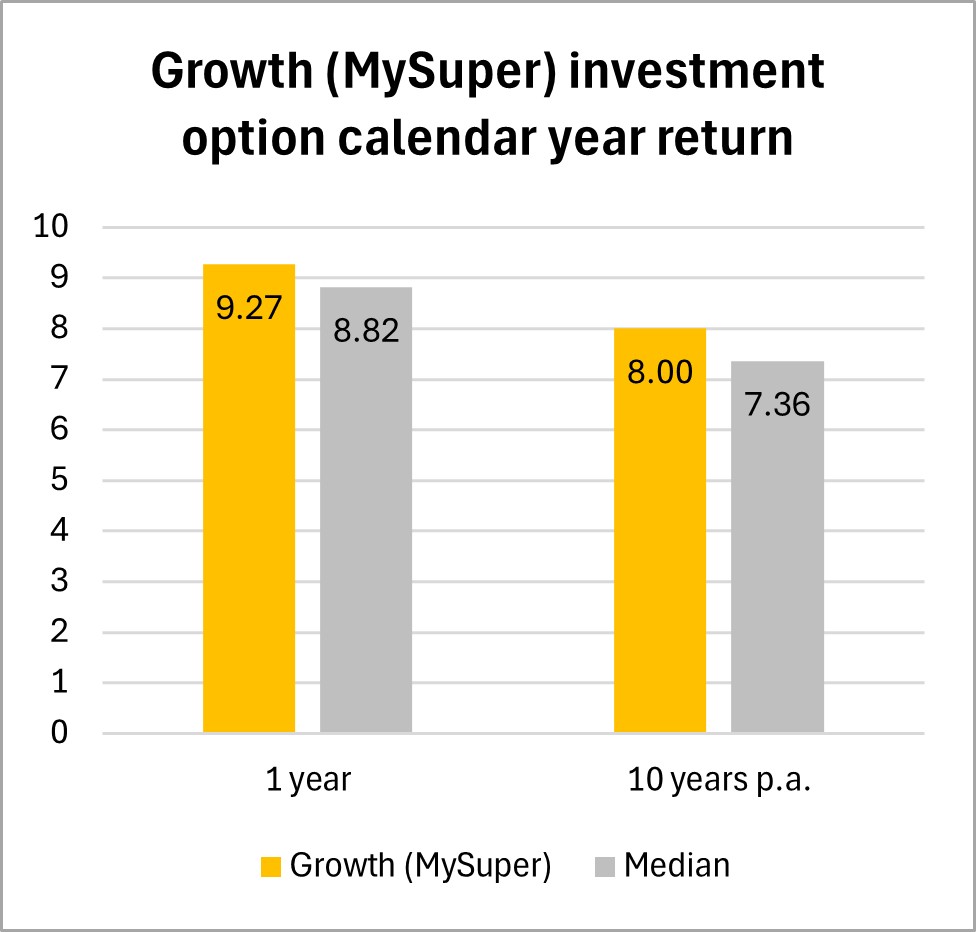
- Our default – the Growth (MySuper) investment option calendar year return was 9.27%
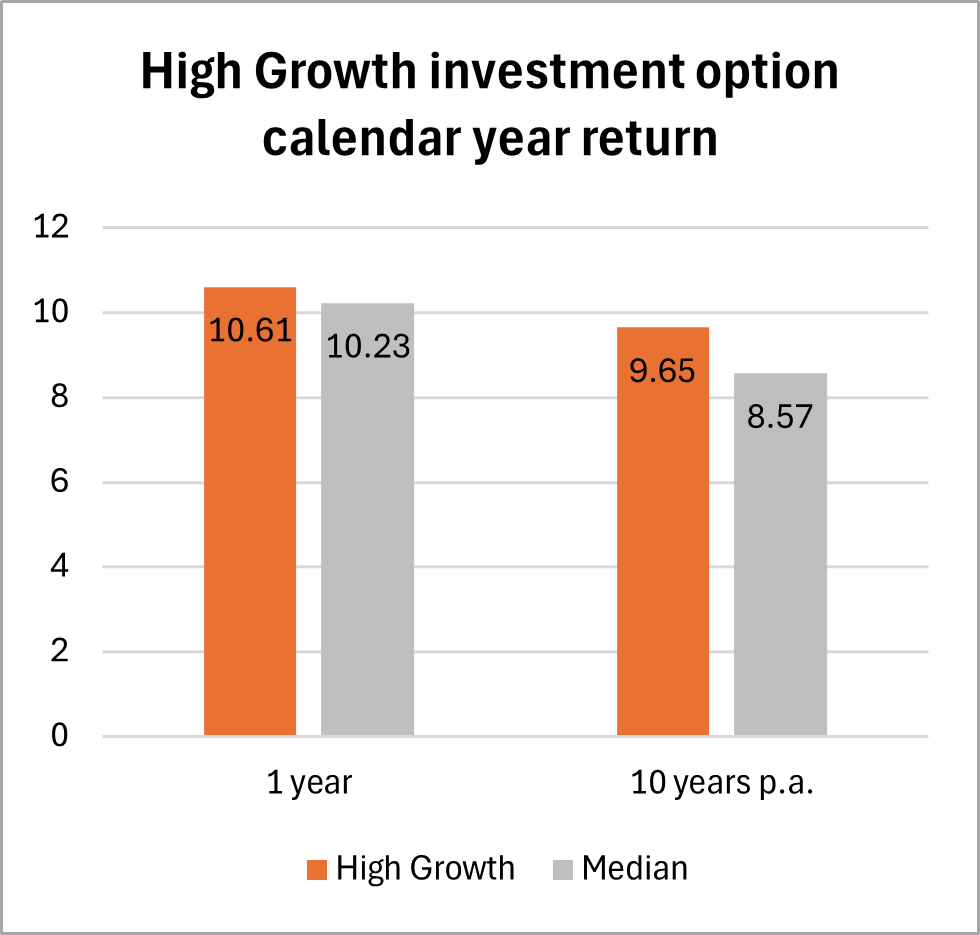
- Our High Growth investment option, which is skewed towards younger members, returned 10.61% in 2025
- We continue to be a top performing super fund over the long term for both options
- Market ups and downs will continue in 2026, but we remain confident in our ability to continue to deliver strong long-term investment returns for our members.
Solid performance amidst global challenges
2025 was another strong year for most major asset classes. Our Growth (MySuper) investment option returned a healthy 9.27% for the calendar year, which was ahead of the median super fund return in 2025 and above its 10-year average annual return of 8.00%.1
Our High Growth and Indexed Diversified investment options also performed well, returning 10.61% and 9.98%, respectively. Our High Growth investment option, which our young members are increasingly interested in, has delivered a 10-year average annual return of 9.65%.
Over the long term, we are proud to be one of the top performing super funds with our Growth (MySuper) investment option also obtaining a top quartile performance ranking over 10, 15 and 20 year periods.2
For our Super Income Stream fully retired members, the Conservative Growth investment option returned 8.06%. This brings its 10-year average annual return to 7.03%.
Global shares were the biggest contributor to our results. Strong performance from infrastructure, property, private equity and global credit asset classes also contributed.
Global shares lead the way in 2025
Share markets started the year strongly. But the scale of the US tariff announcements in April caused a lot of share market volatility for all super funds, including us.
Even with this volatility, global and emerging market shares rose strongly throughout the middle of the year. Much of this growth came from companies exposed to technology and AI.
We saw a slowdown of global share prices towards the end of the year. The main reasons were the US government shutdown, concerns that technology and AI stocks had become too expensive, and continued geopolitical uncertainty. In this environment, our diversified investment model comes to the fore, as it did again in the December 2025 quarter, where we performed strongly compared to peers.3
Share prices remain high, but we continue to see opportunities if the global economy stays steady and companies keep producing strong earnings growth. Particularly in the US tech sector. However, geopolitical risk and the somewhat disjointed series of announcements coming out of the US continue to provide unprecedented levels of uncertainty to the outlook. This is why we remain cautiously optimistic.
Highlights across our portfolio
Our direct investment in the Jandakot Airport joint venture made a strong contribution to our property returns. This investment covers the Jandakot general aviation airport, existing industrial properties, and land available for future development in Perth. We hold a 33.3% ownership stake in this venture.
The wider property sector also saw a recovery. This included Cbus Property, our fully owned entity, which is on track to deliver a high single-digit return. Major projects like 205 North Quay in Brisbane and Nine The Esplanade in Perth reached practical completion. Cbus Property also unveiled plans for its 25th Greater Melbourne project at 43-67 River Street in Richmond.
CyrusOne, a global data centre company that builds, and operates advanced digital infrastructure for some of the world’s leading organisations, was another standout in 2025. In 2022, we invested alongside KKR and Global Infrastructure Partners in the US$15 billion acquisition. It was the largest data centre M&A transaction at that time.
In August 2025, we announced a new investment in Atmos Renewables (Atmos) through our partnership with Igneo Infrastructure Partners. Atmos is focused on renewable energy projects across Australia. It also supports Australia’s future energy needs while delivering long-term returns for our members.
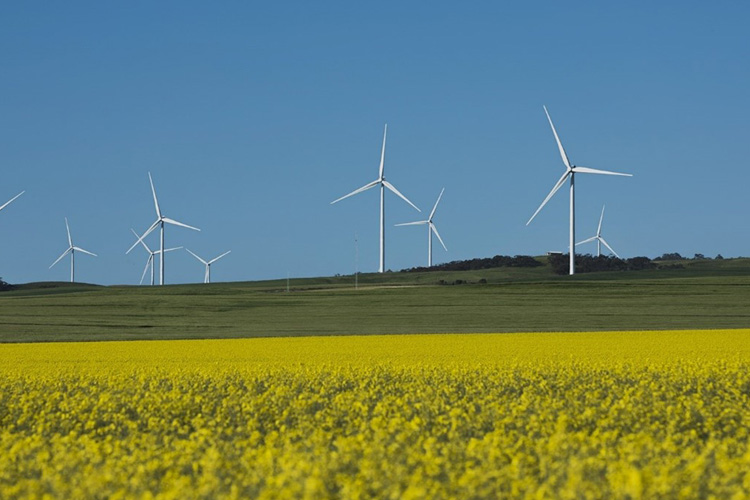
Hornsdale Wind Farm
What to watch for in 2026
Interest rates, geopolitical tensions, and market valuations will likely remain as important themes in 2026.
Even so, we are cautiously optimistic about the outlook and confident in our ability to deliver strong long-term investment returns for our members.
1 Investment performance is based on the crediting rate, which is the investment return minus investment fees and costs, transaction costs and investment-related taxes and until 31 January 2020, the percentage-based administration fee. Excludes fees and costs that are deducted directly from members’ accounts. Past performance is not a reliable indicator of future performance. The median has been taken from the median balanced investment option return in the SuperRatings FCRS Balanced (60-76) Index, for the period ending 31 December 2025. SuperRatings is a rating agency that collects information from super funds to enable performance comparisons - visit www.superratings.com.au for details of its rating criteria.
2 The Growth (MySuper) investment option obtained a top quartile performance ranking over 10, 15 and 20 year periods from the SuperRatings FCRS SR50 Balanced (60-76) Index, for the period ending 31 December 2025. SuperRatings is a rating agency that collects information from super funds to enable performance comparisons - visit www.superratings.com.au for details of its rating criteria. Past performance is not a reliable indicator of future performance.
3 Based on the SuperRatings FCRS SR50 Balanced (60-76) Index (December 2025). The Growth (MySuper) investment option was ranked 6th for the quarter ending 31 December 2025.